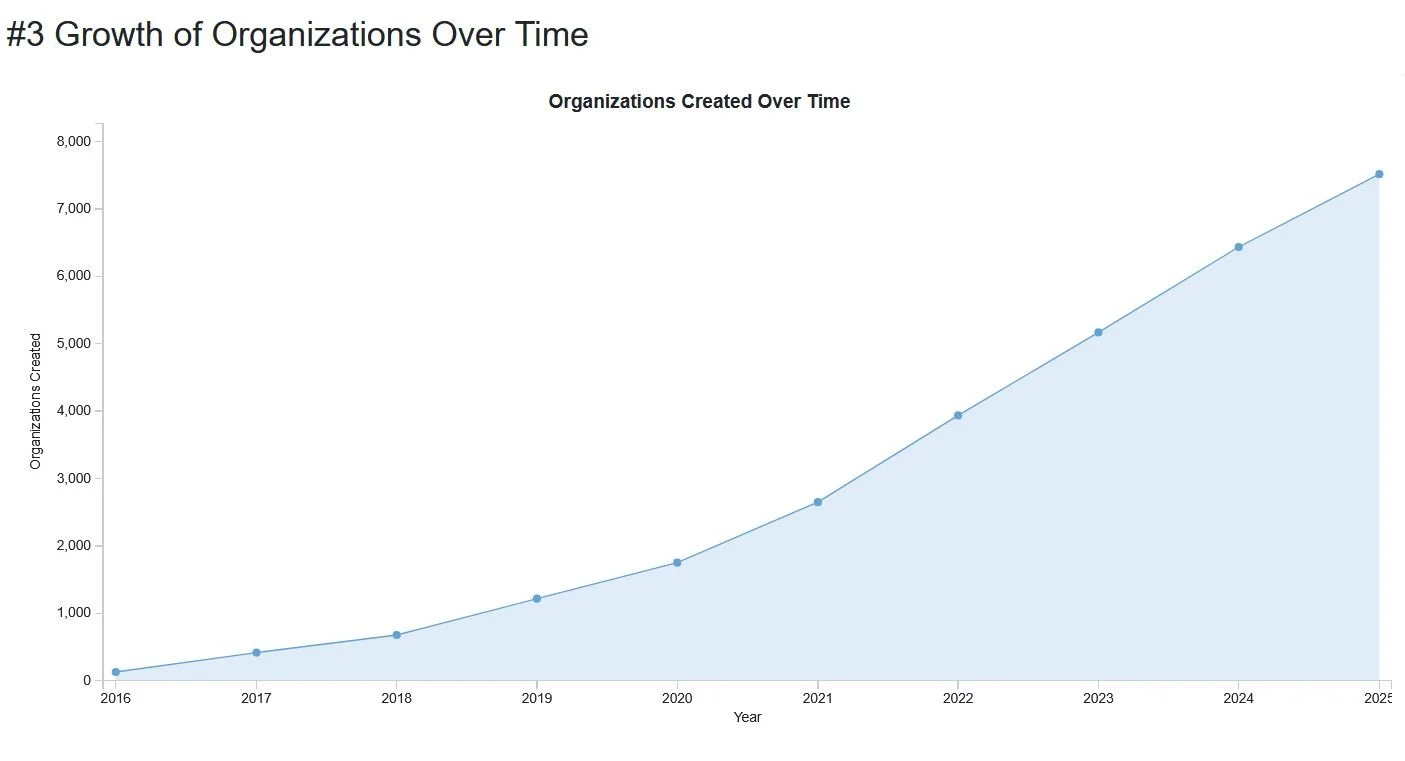
We looked at how over 7,000 organizations are structured on mWater, and the range has impressed us.
Read More
We looked at how over 7,000 organizations are structured on mWater, and the range has impressed us.
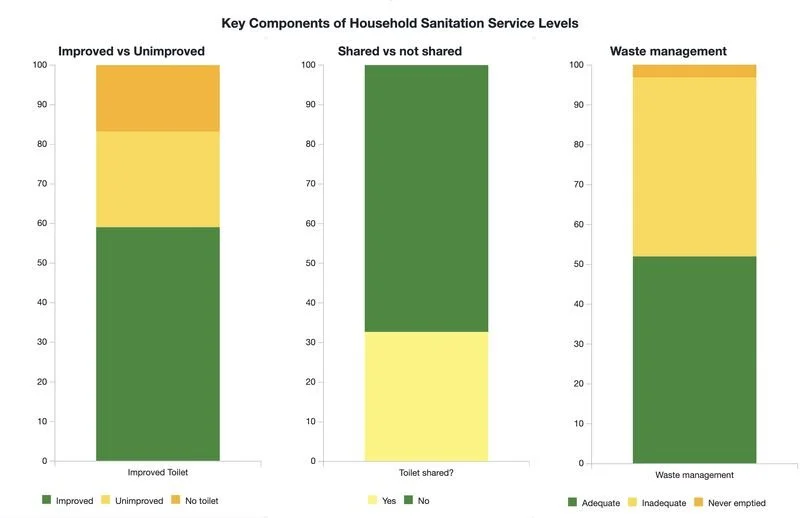
Read MoreAlmost 260,000 data points classified using the JMP service ladder from Open Defecation through to Safely Managed.
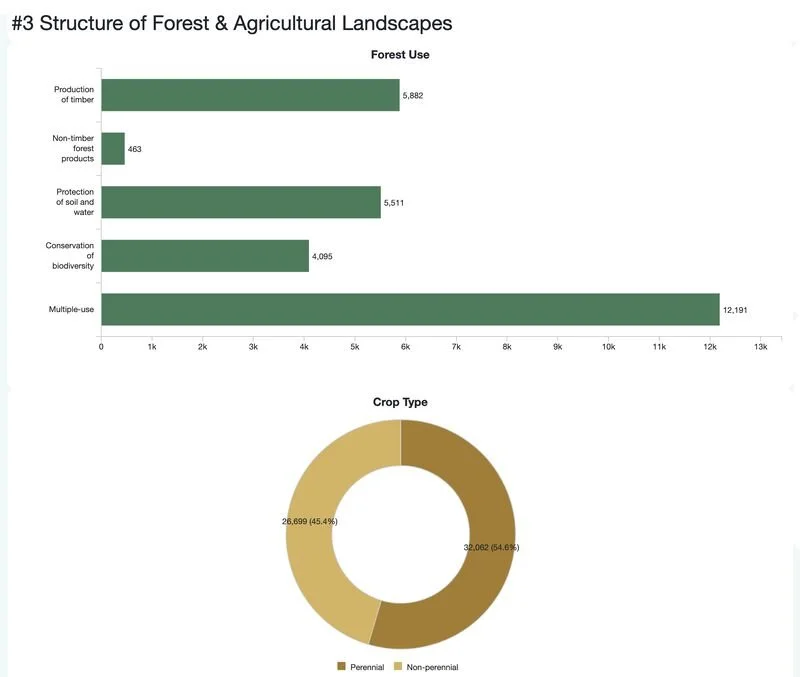
Read MoreWhere are the world's food systems actually taking shape? On farms and in forests that someone has to map.
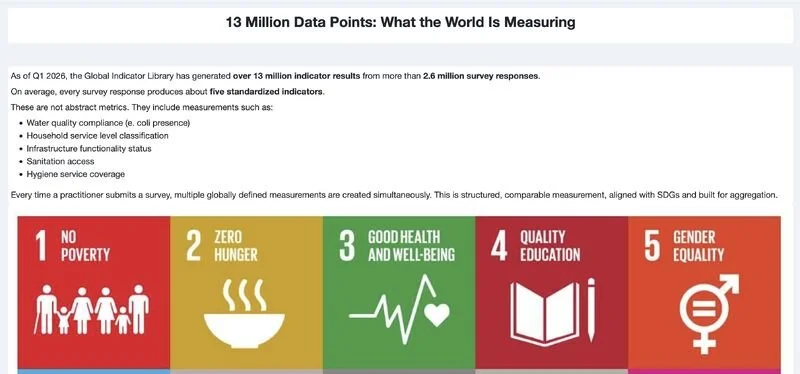
Read More2.6 million survey responses. Over 13 million standardized indicator results. We dug into the data behind the Global Indicator Library.
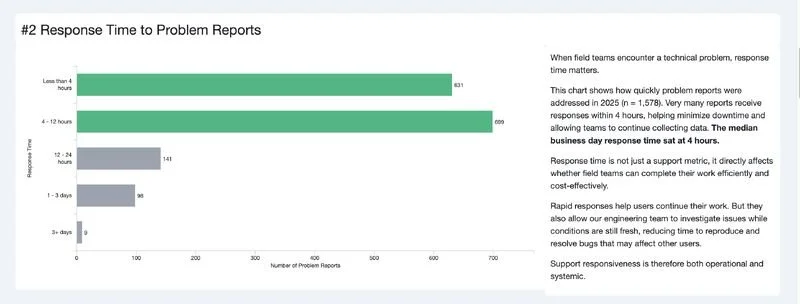
Read MoreIn 2025, mWater received 1,578 problem reports from users collecting data in the field across mobile and web environments. Ease of use and user satisfaction are of paramount importance for us as we run and develop our platform, and we put in every effort to resolve user issues.
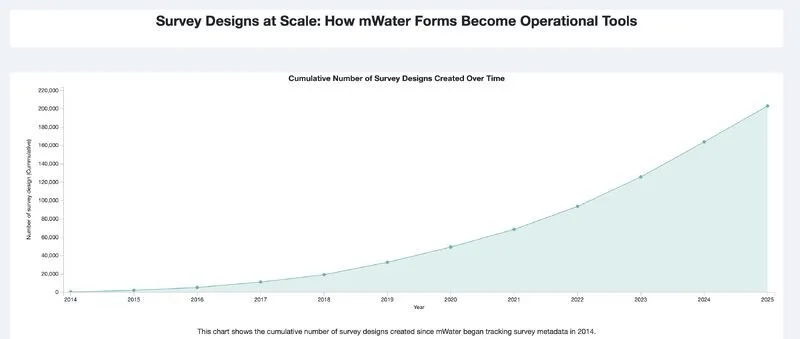
Read MoreSince 2014, over 200,000 survey designs have been created in mWater and more than 44 million responses submitted.
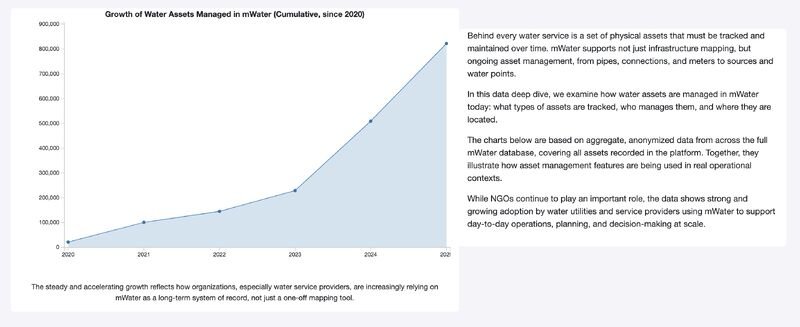
Read MoreBuilding sustainable water services is less about the initial construction and more about the quiet work that happens every day to keep systems running.
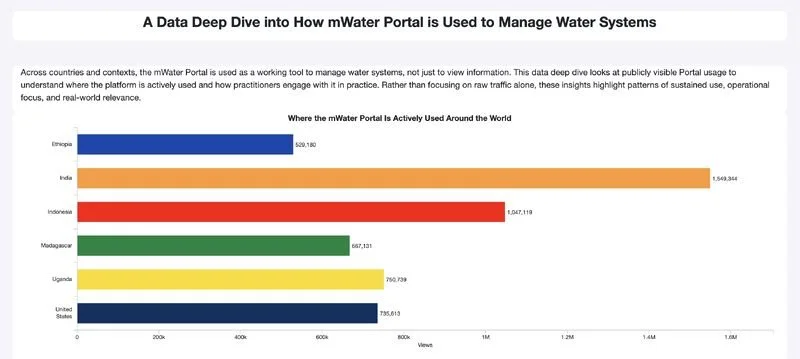
Read MoreLooking at publicly visible Portal activity provides a useful window into how the mWater Portal supports day-to-day water system management.
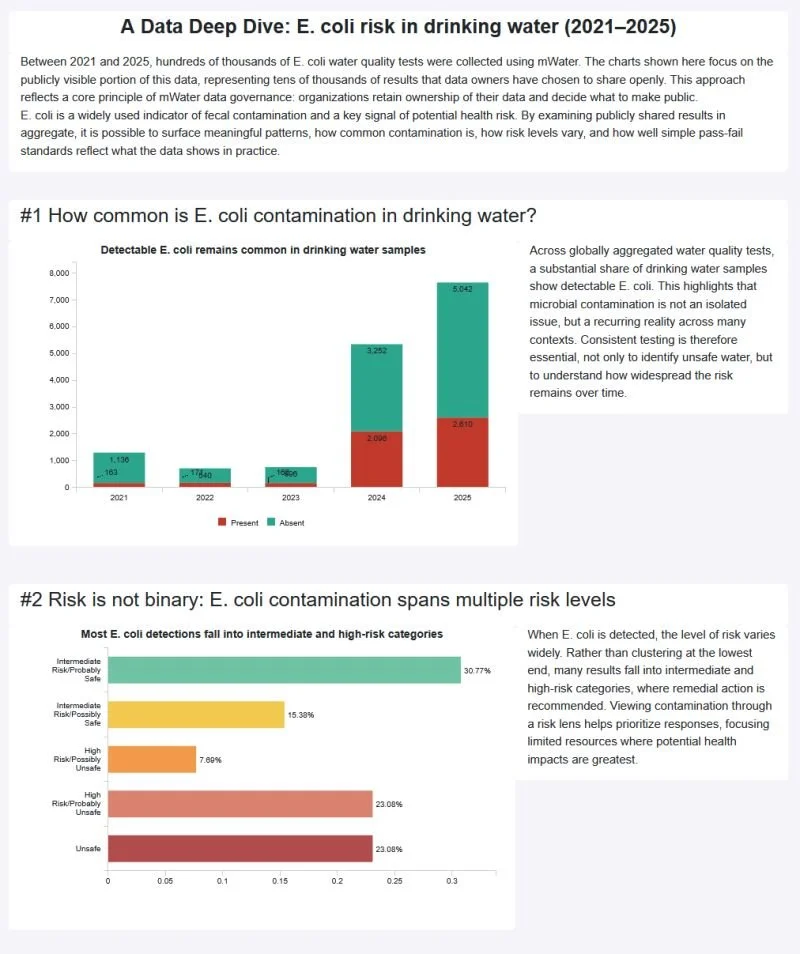
Read MoreThis data deep dive highlights the sharp rise in E. coli detection rates from 2021 to 2025, emphasizing that contamination is not isolated but widespread—underscoring the need for consistent water quality testing.
Read MoreInaugurating this year's set of deep dives into publicily visible data in mWater, here's an animation of water point infrastructure mapped in the last ten years, each dot representing one of the more than one million points mapped.
Read More