
mWater’s Impacts
mWater is the most widely used free data platform in the water, sanitation, and hygiene (WASH) sector. Since 2012, governments, utilities, NGOs, researchers, and community organizations have used mWater to collect, manage, analyze, and share data that drives improved water and sanitation services. Through mapping digital infrastructure, public servants and their stakeholders are able to grow impact and efficiency with data-driven management.
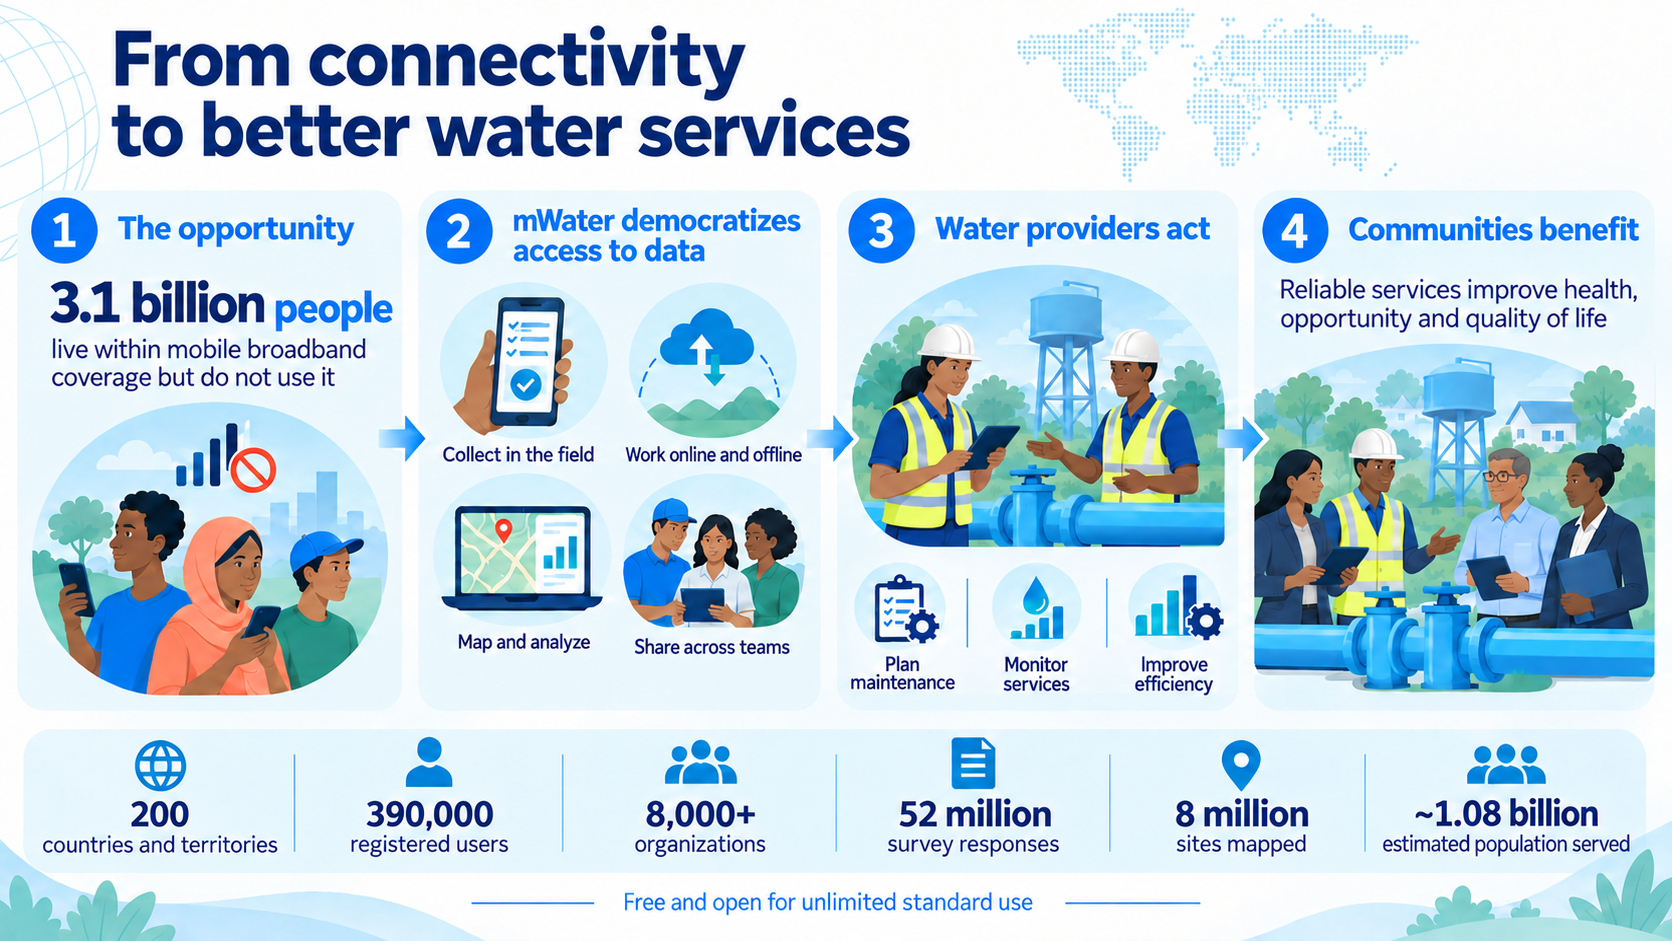
Despite the rapid expansion of mobile broadband, billions of people are still not benefiting from digital connectivity. GSMA reports that 3.1 billion people, or 38% of the world’s population, live in areas covered by mobile broadband but do not use it. Affordability, digital literacy and skills remain major barriers, particularly in low- and middle-income countries, rural communities and among women.
For water service providers, expanding mobile broadband coverage creates an opportunity to use digital tools to improve both their impact and efficiency. Field teams can collect and share information from across a service area, managers can see the condition and performance of infrastructure, and providers can use the same data to plan maintenance, monitor services and make better decisions.
The stakes are especially high for women and girls. Where water is not available on premises, they carry a disproportionate share of the burden of collecting it, taking time away from education, work and other opportunities. Improving water services is therefore not only about infrastructure. It is also about giving the people responsible for delivering those services the information and tools they need to reach more people and manage systems more effectively.
mWater is helping democratize access to those tools. The platform makes it easier for governments, utilities and organizations to collect information in the field, manage and analyze it in one place, share it across teams and turn it into evidence that can guide better decisions. It is free and open for unlimited standard use, works online and offline, and is designed for use in low-resource contexts.
How the Data Creates Change
Governments plan and budget for water and sanitation infrastructure with evidence rather than estimates
National and regional authorities track progress toward SDG 6, understanding where gaps remain and making the case for investment
Utilities monitor revenue, asset condition, and service coverage in real time, catching problems before they become crises
Water quality surveillance, E. coli testing, and contamination risk assessment protect the communities most vulnerable to waterborne disease
When disasters strike, response teams use mWater for rapid infrastructure assessments, getting resources where they are needed faster
Researchers at universities worldwide rely on the platform for rigorous, affordable data collection, strengthening the evidence base that shapes sector policy
Donors and development finance institutions can see where investment is most needed and where it is most likely to deliver lasting results
Here is a snapshot of the platform’s reach and activity:
Platform Cumulative Reach
| Metric | Figure |
|---|---|
| Countries and territories served | 199 |
| Registered user accounts | 390,000 |
| Organizations signed up | 7,000+ |
| Survey forms designed | 200,000+ |
| Survey responses submitted | 52,000,000 |
| Languages supported | 28 |
Daily Platform Activity
| Metric | Per Day |
|---|---|
| Survey responses submitted | 60,000+ |
| Images uploaded from the field | 50,000+ |
| Infrastructure sites mapped | 5,000+ |
| New user accounts | 200 |
Monitoring Public Infrastructure
| Metric | Sites mapped | Estimated Population Served* |
|---|---|---|
| Water points | 1,700,000+ | 510,000,000 |
| Water systems | 100,000+ | 400,000,000 |
| Sanitation facilities | 380,000+ | 19,000,000 |
| Schools | 175,000+ | 70,000,000 |
| Health facilities | 42,000+ | 84,000,000 |
| Total | 2,397,000+ | ~1,083,000,000 |
Note: Above are the key site types tracked. However, there are 8,000,000 sites mapped altogether in the platform, including household and other types.
* Methodology: Estimated population served based on the standard JMP classifications for beneficiary reach: 300 people for each water point, 4,000 for each water system, 50 per sanitation facility, 400 per school, and 2,000 per mapped health facility.
User accounts, survey responses, and countries and territories updated September 14, 2026. Other figures reflect Q1 2026.
Partners & Reach
Over 8,000 organizations use the mWater platform, spanning governments, water utilities, international organizations, NGOs, academic institutions, and community-based service providers.
International organizations and donors: UNICEF (Angola, Madagascar, LIXIL partnership monitoring), the Conrad N. Hilton Foundation (Uganda district mapping), USAID (Haiti water and sanitation, 19 Counties of Kenya under STAWI, Indonesia IUWASH PLUS)
NGOs and implementing partners: WaterAid (national WASH monitoring across multiple countries), World Vision, Water.org, charity: water, Water for People, The Water Project, Safe Water Network, Medair, IRC WASH (RapidWASH partnership), Water Mission, Dig Deep / Dig Deep Africa, BASEflow Malawi, and many more.
Government deployments: Angola (national cholera MIS), Guinea-Bissau, Haiti (all urban water utilities), Indonesia, Kenya (19 counties), Kiribati, Madagascar, Malawi, Papua New Guinea (first national WASH monitoring system), Uganda (district-wide water point mapping), Zimbabwe.
Public-Private Partnerships: CRS (Azure digital water service provider platform), Water4
Research and academic use: Researchers at universities worldwide who use the platform for affordable, rigorous field data collection
See the Blog for various Data Deep Dives to learn more.