mWater as a Digital Public Good
In itself, mWater is a digital public good. The platform is a free sector resource with over 200,000 users in 191 countries. The codebase is also used in two additional platforms, the Global Water Monitoring Challenge (map.monitorwater.org) and Solstice.World. mWater has a standard API for accessing data for use in collaboration with other platforms.
Specific contributions as digital public goods

mWater actively contributes to open source initiatives
mWater Open Source contributions: mWater’s source code is 70% open source, only excluding small portions to prevent fragmentation of the data, which would reduce collaboration potential among the many mWater users worldwide. Core server and web portal code are closed source. However, as we develop technology that is more generically useful in the wider community, we spin those parts off as open source projects such as minimongo, an open source implementation of the popular MongoDB database for use client-side, allowing apps to store data effectively offline and sync with a server safely. It has been adopted widely and is used in thousands of projects on GitHub. We create and contribute to hundreds of open source codebases: https://www.mwater.co/mwater-policies/#tabpanel-open-source

Metrics for Management EquityTool is a set of 13-15 questions for each country that you can add to a survey to enable desegregating data by wealth quintile: https://equitytool.org/2021-equity-measurement-prize-winners/
This is how it is used in mWater’s Indicator Library: https://portal.mwater.co/#/indicators/af553342bdc2433c9c9117d804dc81c3

Columbia University’s CEISIN lab provides satellite demographic data that platforms like mWater have integrated to enable calculating population in relation to sites and assets: https://grid3.org/
This is how mWater allows users to add population density overlays in maps, and even calculate population by drawing a polygon on the map: https://portal.mwater.co/#/resource_center/population_density
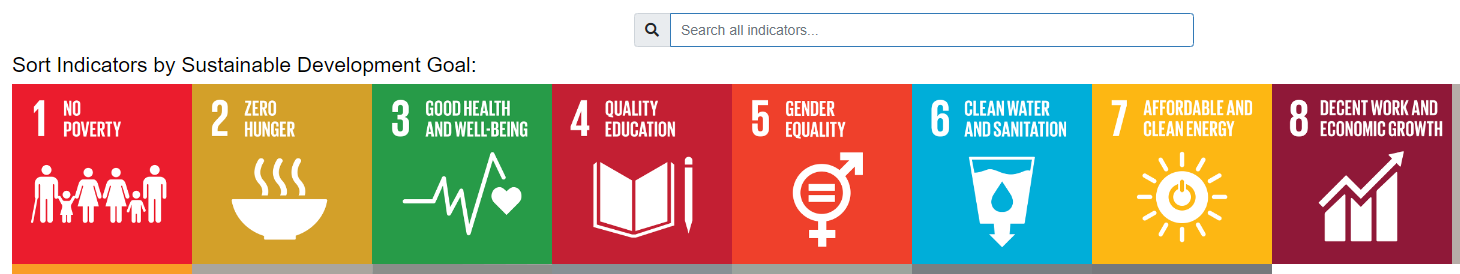
mWater’s Global Indicator Library: https://portal.mwater.co/#/indicators
This is a wikipedia-inspired repository of indicators as measured by well-tested question sets. Within one click, a user can build a survey that is tested and structured. Each indicator page includes references, has upvote capability, is comment-enabled, and shows up in searches by use so that better tested sets tend to be used more. An example of a highly used indicator set is the JMP Sanitation Service Level, which has been used in mWater over 25k times: https://portal.mwater.co/#/indicators/d4cc38cf93d849339b32a9d5f1f5630a
This has grown to the point that sector leaders approach us with funding for developing open source indicators in the library, such as with WHO’s Water and Sanitation for Health Facility Improvement Tool (WASH FIT): https://portal.mwater.co/#/indicators/cf2bb12ab8b84d3b8a401dc27dd8d66e
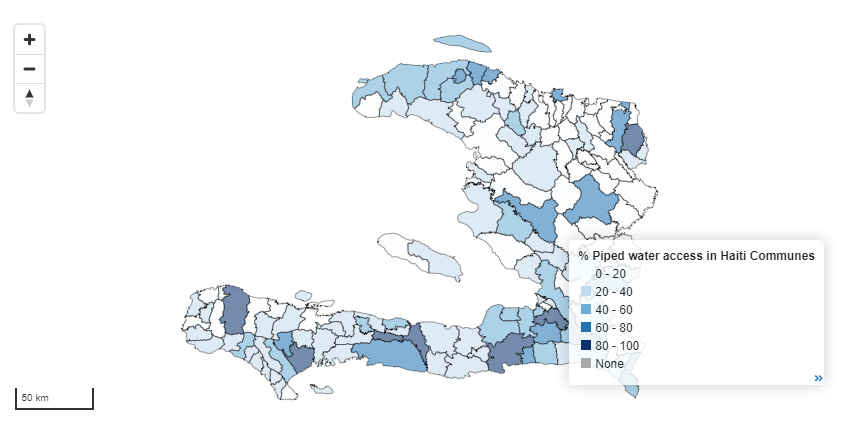
mWater’s Open Source Administrative Boundary library of shapefiles: While there are many open source mapping layers of admin boundaries available, most famously Open Street Map, these are crowdsourced by the general public. Our library is based on the library provided by the open sources Database of Administrative Areas (GADM.org), and only includes official administrative boundaries as recognized by the governments represented. It is refreshed when a government contacts us to say a border is out of date. We only update boundaries from national statistics bureaus. Where possible, the library includes levels one through four—national, regional, district, and village. For geospatial analysis, for all locations and sites mapped, users can calculate which boundaries they fall within. https://portal.mwater.co/#/dashboards/92409f787a6d4b83b95ba8078a1ffceb