
CIESIN, UWP
Population Density Layers

Query population data in maps, dashboards and tables.
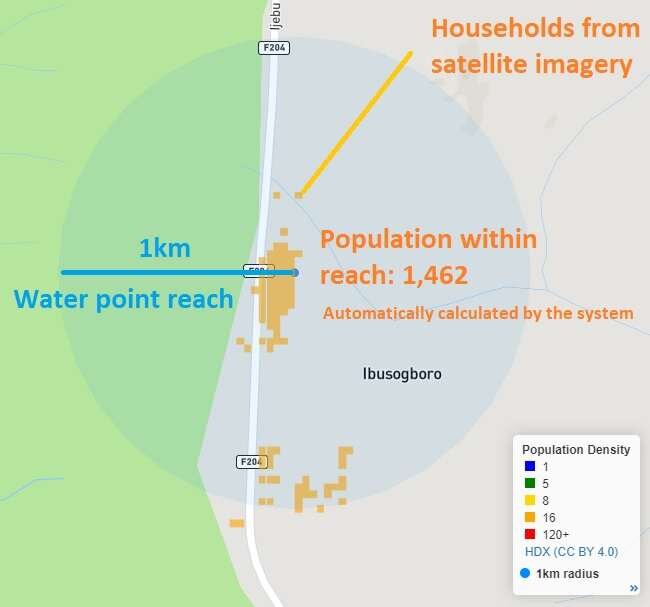
We have taken open source population density data and added it as a layer anyone can easily access when planning or monitoring WASH work. This means you can now pick a point anywhere in the world, choose a radius, and get an estimate of how many people are living within that circle.
So if you want to know how many people live within 1km of an existing or planned water point, for example, you can now use the Population Within expression in mWater to find that out. The same option is available for all geolocated data such as your surveys.
mWater users are now using the population estimates to plan new interventions, spot gaps in service, and validate reach.
A testimonial from the Ugandan Water Project:
mWater’s population estimate feature gives the Ugandan Water Project an additional, objective, tool that they use to cross check population estimates provided locally by key informants and existing records.
One way the Ugandan Water Project uses this feature is to estimate how many people live within a set distance of any borehole. While any distance can be analyzed, the Ugandan Water Project typically employs a 1 km cut-off, which approximates the maximum distance for a 30-minute round trip to the borehole, with fetching time included. The 30-minute benchmark is significant because it is a requirement for basic household water access, according to the industry standard JMP Service Ladder.
With improved methods of population estimation supported by this mWater feature, the Ugandan Water Project is better equipped to plan programs and accurately report impact to donors.
This population density data is sourced from the Humanitarian Data Exchange and shared under a Creative Commons license (CC BY 4.0). The data is derived from satellite imagery using machine learning cross-referenced with census data and it is due to be updated every 3 months.
See this guide for how to use population layer data in your visualizations and analyses.
Dive deeper with a case study on how the population estimates are being used to further water infrastructure planning in Malawi.

You can easily add a population data layer to any mWater map.